Reading a response
If you prefer a video walk-through, you can watch this 5min video on accessing and interpreting an sustainability practices response.
A response to the sustainability practices questionnaire is composed of three parts:
- Summary section
- Answers to the policies core section
- Answers to industry-specific sustainability practices - optional
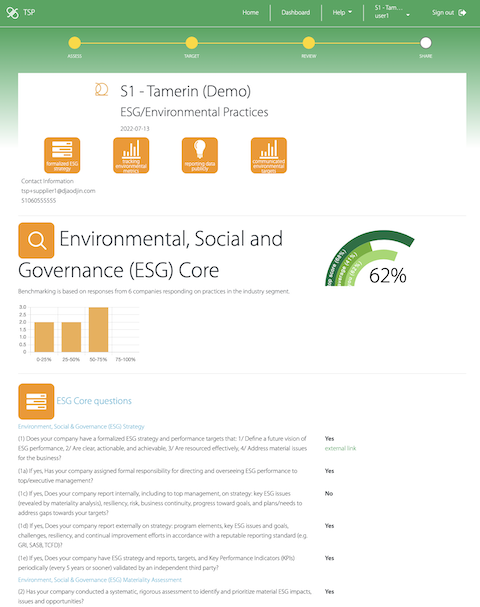
1. The summary section shows
- The name of the company responding
- The primary contact information for the company
- The date the assessment was completed
- The score on the policies core section (How does scoring works?)
- key questions answered as icons - orange when the question/section was answered affirmatively. grey when the question/section was not answered or answered negatively.
- Environmental impact the improvement plan is targetting (GHG Emissions & Energy, Water, Waste) - optional
The areas covered in the improvement planning radar chart are computed from the aggregated environmental impact (Energy & GHG Emissions, Water, Waste) associated to practices in industry-specific sections (ex: Construction) that were selected to be part of the improvement plan.
Below the top level section, bar charts show how the company scores fare against other respondents. Each bar chart shows the number of suppliers in the 0%-25%, 25%-50%, 50%-75%, and 75%-100% score range for specific sections. Together with the company score shown on the right side, one can intuitively grasps where the company fit amongst its peers.
2. In the detailed answers to the policies core section, each question shows the title of the question, the response from the company, including any comments and/or links to supporting documentation.
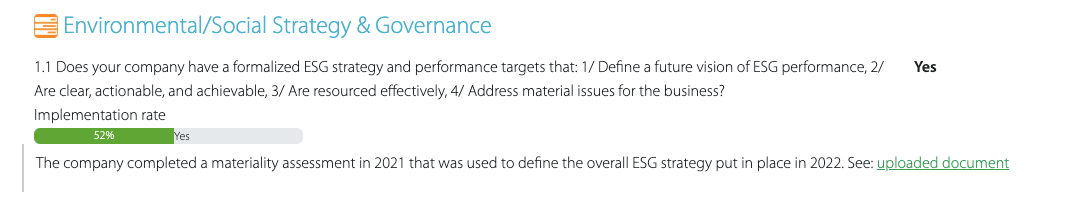
The implementation rate shows the percentage of peers answering Yes for that question.
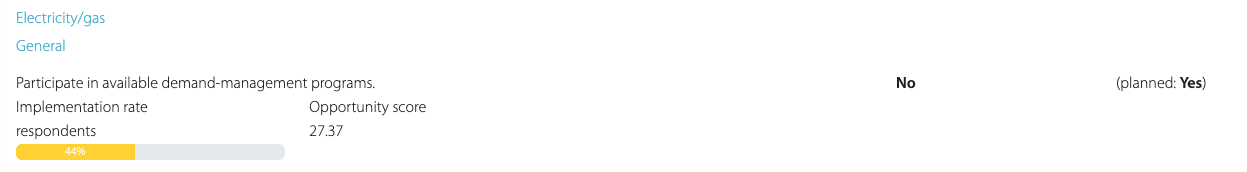
3. While the policies core section is focused more on policies, management and reporting, industry-specific sections present an assessment of actionable sustainability practices. These practices can be implemented as part of an improvement plan.
Opportunity scores for a practice is connected to improvement to the industry score that could be gained by implementing the practice (higher is better). Calculation used to derive opportunity score: Opportunity score = (intrinsic value assigned to a practice) x ( 1 + implementation rate ) x (3 – value assigned to the answer (i.e. Yes, Mostly Yes, Mostly No, No).
Note: Using this methodology means that the opportunity score for any practice will increase as the implementation rate for a practice increases (as new users complete the assessment and report implementing the practice). This results in a minor bias against early adoption of a practice; however, testing showed the bias to be negligible.
How does scoring work?
Scoring on the policies core section is based on points per question (Policies Core Questions with assigned points (.xlsx)). As a result, the policies core section score is independent of peers responding to the sustainability< practices questionnaire.
Scoring on industry-specific practices is on the intrinsic value of the practice as well as its implementation rate amongst peers. As a result, industry-specific scores are an indicator of the opportunity for your organization to prioritize one or another practice in its improvement planning.
- Score for a single practice: Score for a practice is calculated by multiplying the value assigned to the practice by the value assigned to your response to the question “Is this implemented as standard practice?” (See table below for values).
- Score for a section of practices: practices are grouped into sections (e.g. Electricity/gas, Fuel, Waste/pollution). The scores for each practice are used to calculate your percentage score for that section. Each section is also assigned a weight to indicate its relative significance against other sections.
- Total score: Sum of the totals for each section multiplied by their weight.
- Note: Your scores will change slightly as more respondents complete the Assessment for an industry segment.
| Values assigned to a practice to indicate relative value | Values assigned to responses to the question "Is this practice implemented?" | ||
|---|---|---|---|
| Gold | 6 | Yes | 3 |
| Dark green | 3 | Mostly yes | 2 |
| Medium green | 2 | Mostly no | 1 |
| Light green | 1 | No | 0 |
If you are curious, dig into the history on how scoring evolved over the years.
- Need additional help?
- Contact us